In a recent study published by The Society for Competitiveness, 119 consumer facing corporate brands and their revenue growth rates were studied. This study was unique in that product branding contribution to revenue growth is extensively examined but corporate brand contribution to revenue is far less analyzed.
The data examined was for the period from 2011 to 2016 and includes Tenet Partner’s CoreBrand Index® which provides BrandPower (a survey measure of Familiarity and Favorability with a corporate brand), fundamental financial data, and paid media from Kantar Media Intelligence.
This research drew on from our chairman James Gregory, Ph.D. and Jack Weichmann’s definition of the corporate brand – “that is the public’s perception of a company – the preconceived ideas and prejudices that have formed in the minds of customers” (1991, pg.2).
The CoreBrand Index (CBI) was developed to address the lack of quantitative data available on corporate brands. For over two decades it has been the basis of models that measure how the brand contributes to market cap and brand valuation.
The CBI is a telephone interview conducted among an audience of impartial observers. Respondents are business leaders who are also affluent consumers. They are Vice President (VP), Director and Manager level executives in the top 20% of U.S. businesses, based on revenue. Respondents rate their Familiarity with a list of 40 companies. Those that indicate that they know more than just the name of the company are then asked to rate Favorability on three attributes: Overall Reputation, Perception of Management, and Investment Potential. These measures are then combined to create BrandPower, a single measure that conveys the corporate brand’s size and quality among respondents. The measures are reported on a 100-point scale. Each company is rated by 400 respondents per year. Approximately 1,000 companies are tracked, many dating as far back as 1990.
Figure 1 below highlights the analytical process employed by the authors to examine how corporate brand can contribute to revenue growth.

The first step was a correlation matrix that examined BrandPower growth in different time periods compared to revenue growth. 1-, 3-, and 5-year changes were examined. The results were not as encouraging as we expected. Ultimately, it was concluded that the level of BrandPower may be impacting the relationship. Larger brands were maintaining, not growing. Smaller brands were seeking critical mass. However, mid-level brands had both mass and room to grow. This was then proven in our quintile analysis, where we saw the brands in the middle tier had the highest rates of growth for both BrandPower and revenue.
The tiers refer to the company’s level of BrandPower. Tier 1 is the strongest, followed by Tier 2 and so on. Examples of companies in Tiers 1, 2 and 3 are:
- Tier 1 – Coca-Cola & McDonald’s
- Tier 2 – Tyson Foods & Old Navy
- Tier 3 – Pet Smart & Papa John’s
Figure 2 below shows an overall regression analysis of BrandPower growth rate and sales revenue growth rate for all 119 companies.
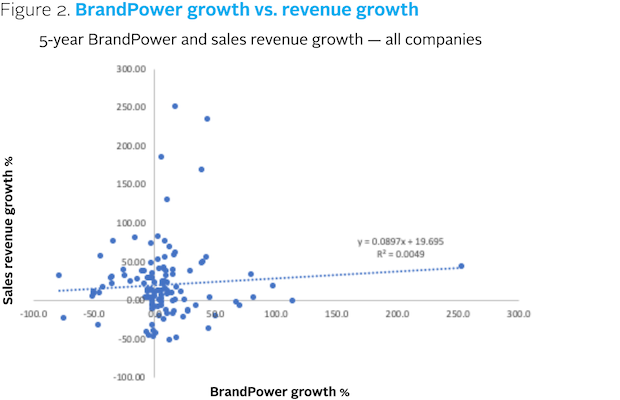
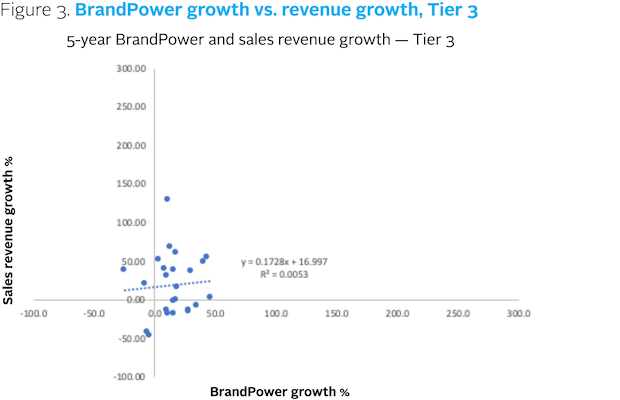
Figure 3 below identifies the same analysis, but with only the middle tier, tier 3, companies. As can be seen by the regression conducted, the growth coefficient is nearly twice for tier three than it is for the entire group, 0.1728 vs. 0.0897. This indicates a higher rate of revenue return for BrandPower growth among the tier 3 companies than for the broader group of competitors. This result informs us that companies in the middle tier have tremendous incentive to improve their BrandPower.
Further analysis of paid media spend and BrandPower demonstrated that as paid media increased BrandPower increased. An analysis of brand valuation showed that for an incremental paid media investment of $1 million, a $2 million increase in brand valuation could be expected. This 2:1 return on investment is a significant argument in favor of investing in the corporate brand.
References
Koch, C., Puckey, B., Williams, V. (2019). Empirical Findings: The Corporate Brand, Competition Forum, American Society for Competitiveness, Vol. 17, Number 1, 2019, (1-12).
Gregory, J.R., & Wiechmann, J.G. (2001). Marketing Corporate Image: The Company as Your Number One Product. Lincolnwood, Illinois: NTC Publishing Group.